Surface Climate Risk
for Local Vulnerable Populations
Translated complex environmental data into an intuitive, agentic experience — turning raw climate intelligence into a practical, life-saving tool for under-resourced communities.
Solo Designing for Resilience
In late 2021, a former design lead reached out to me about ClimaSens. Knowing my passion for environmental sustainability and renewable energy, they invited me to lead the design for a platform that could fundamentally shift how cities prepare for climate change. I joined in early 2022 and took ownership of the entire design and re-design of the product’s core features.
Working with stakeholders like the City of Stockholm, the City of Melbourne, and Red Cross Australia, I transformed ClimaSens into a high-utility SaaS platform. My work centred on helping these organisations benchmark climate resilience by monitoring risks and past impacts — to better predict future environmental performance.
Climate IQ
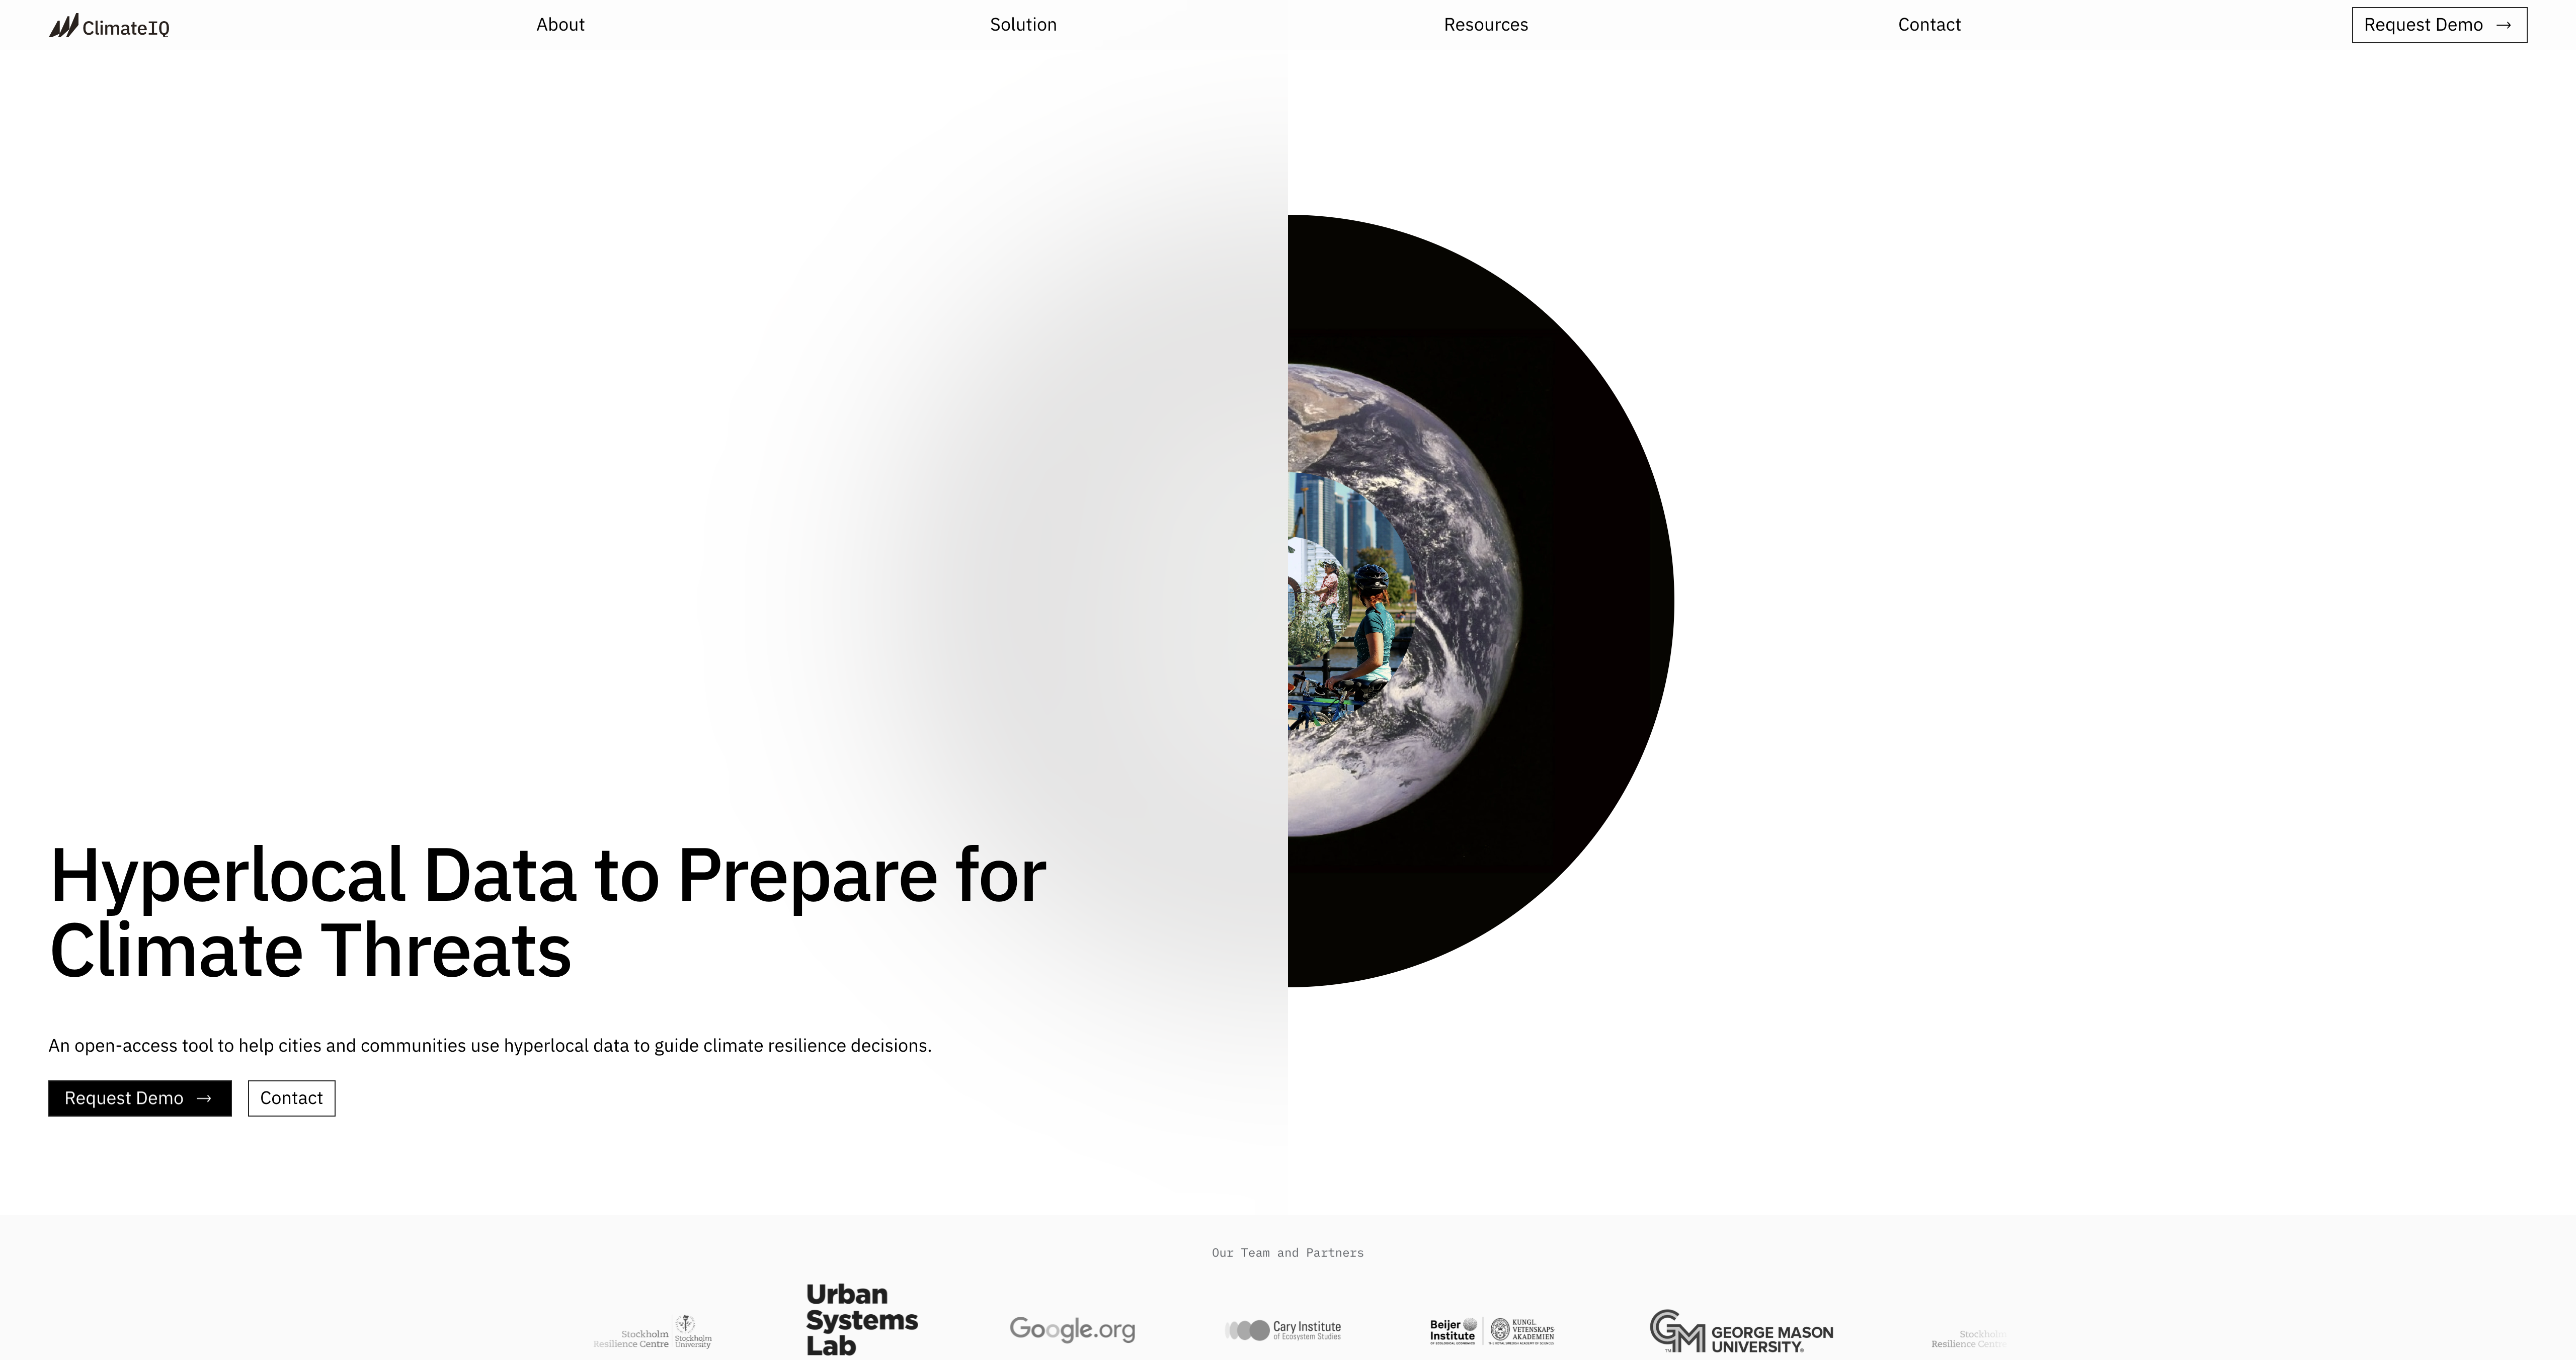
The success of our work at ClimaSens led to an inflection point: securing a $5 million grant from Google.org to build ClimateIQ. The tool was envisioned as a free, open-access platform to democratise climate-risk intelligence for the world’s most under-resourced communities — partnering with The New School Urban Lab and Google.org to translate research-grade climate data into something a local council, NGO, or organiser could actually open and act on.
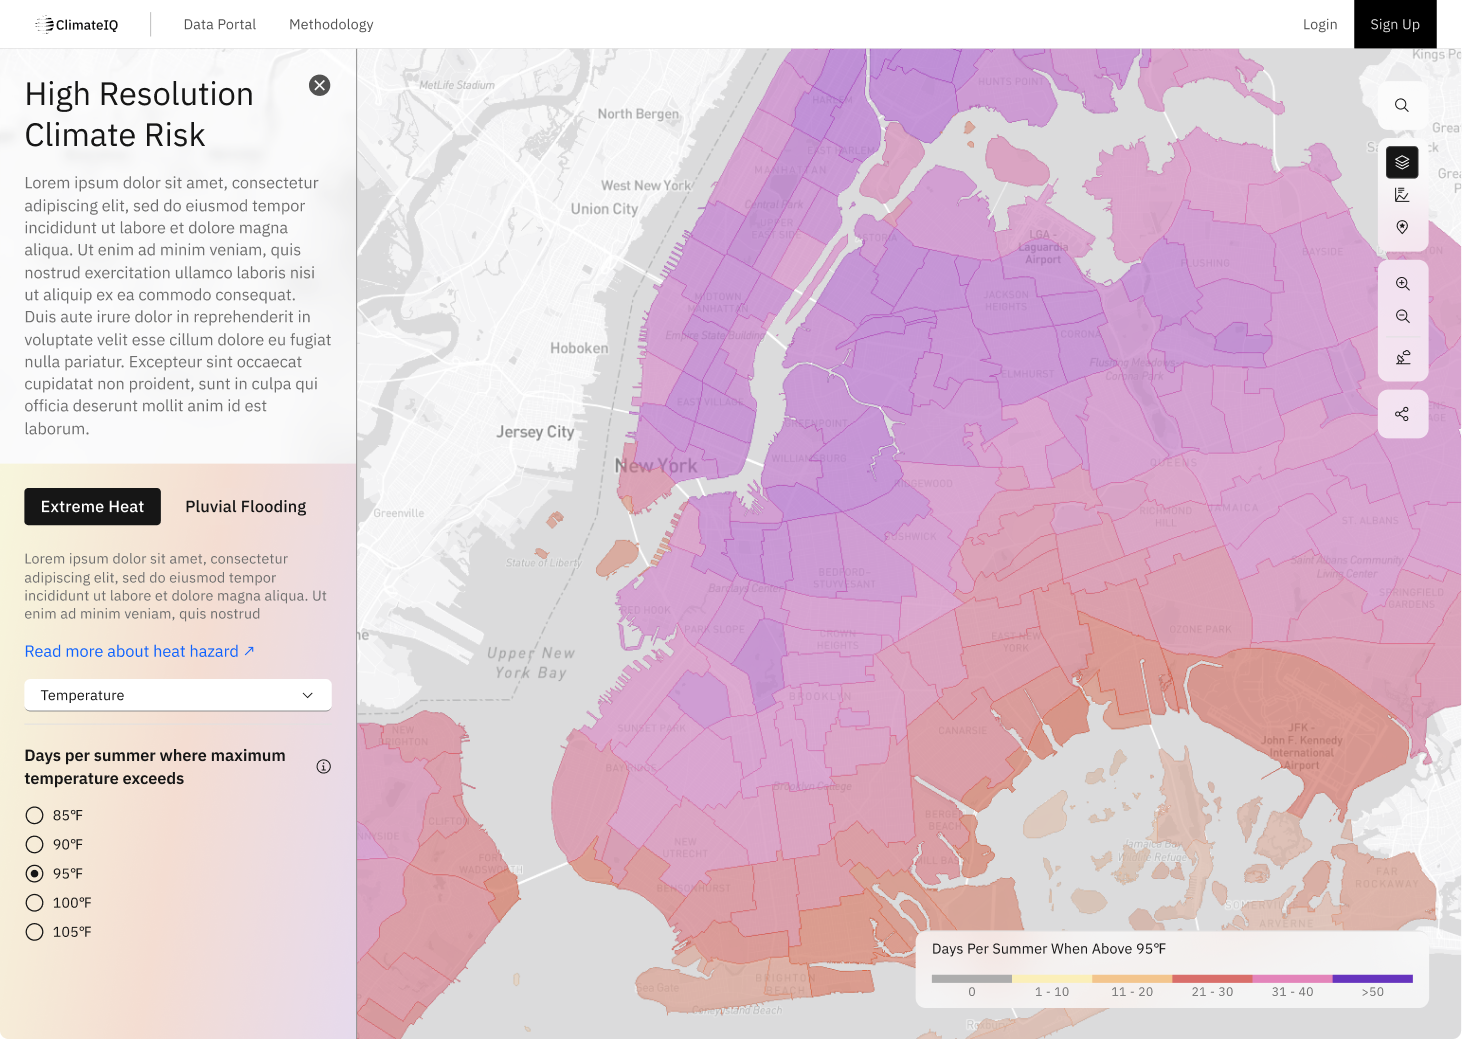
Map but not only a Map
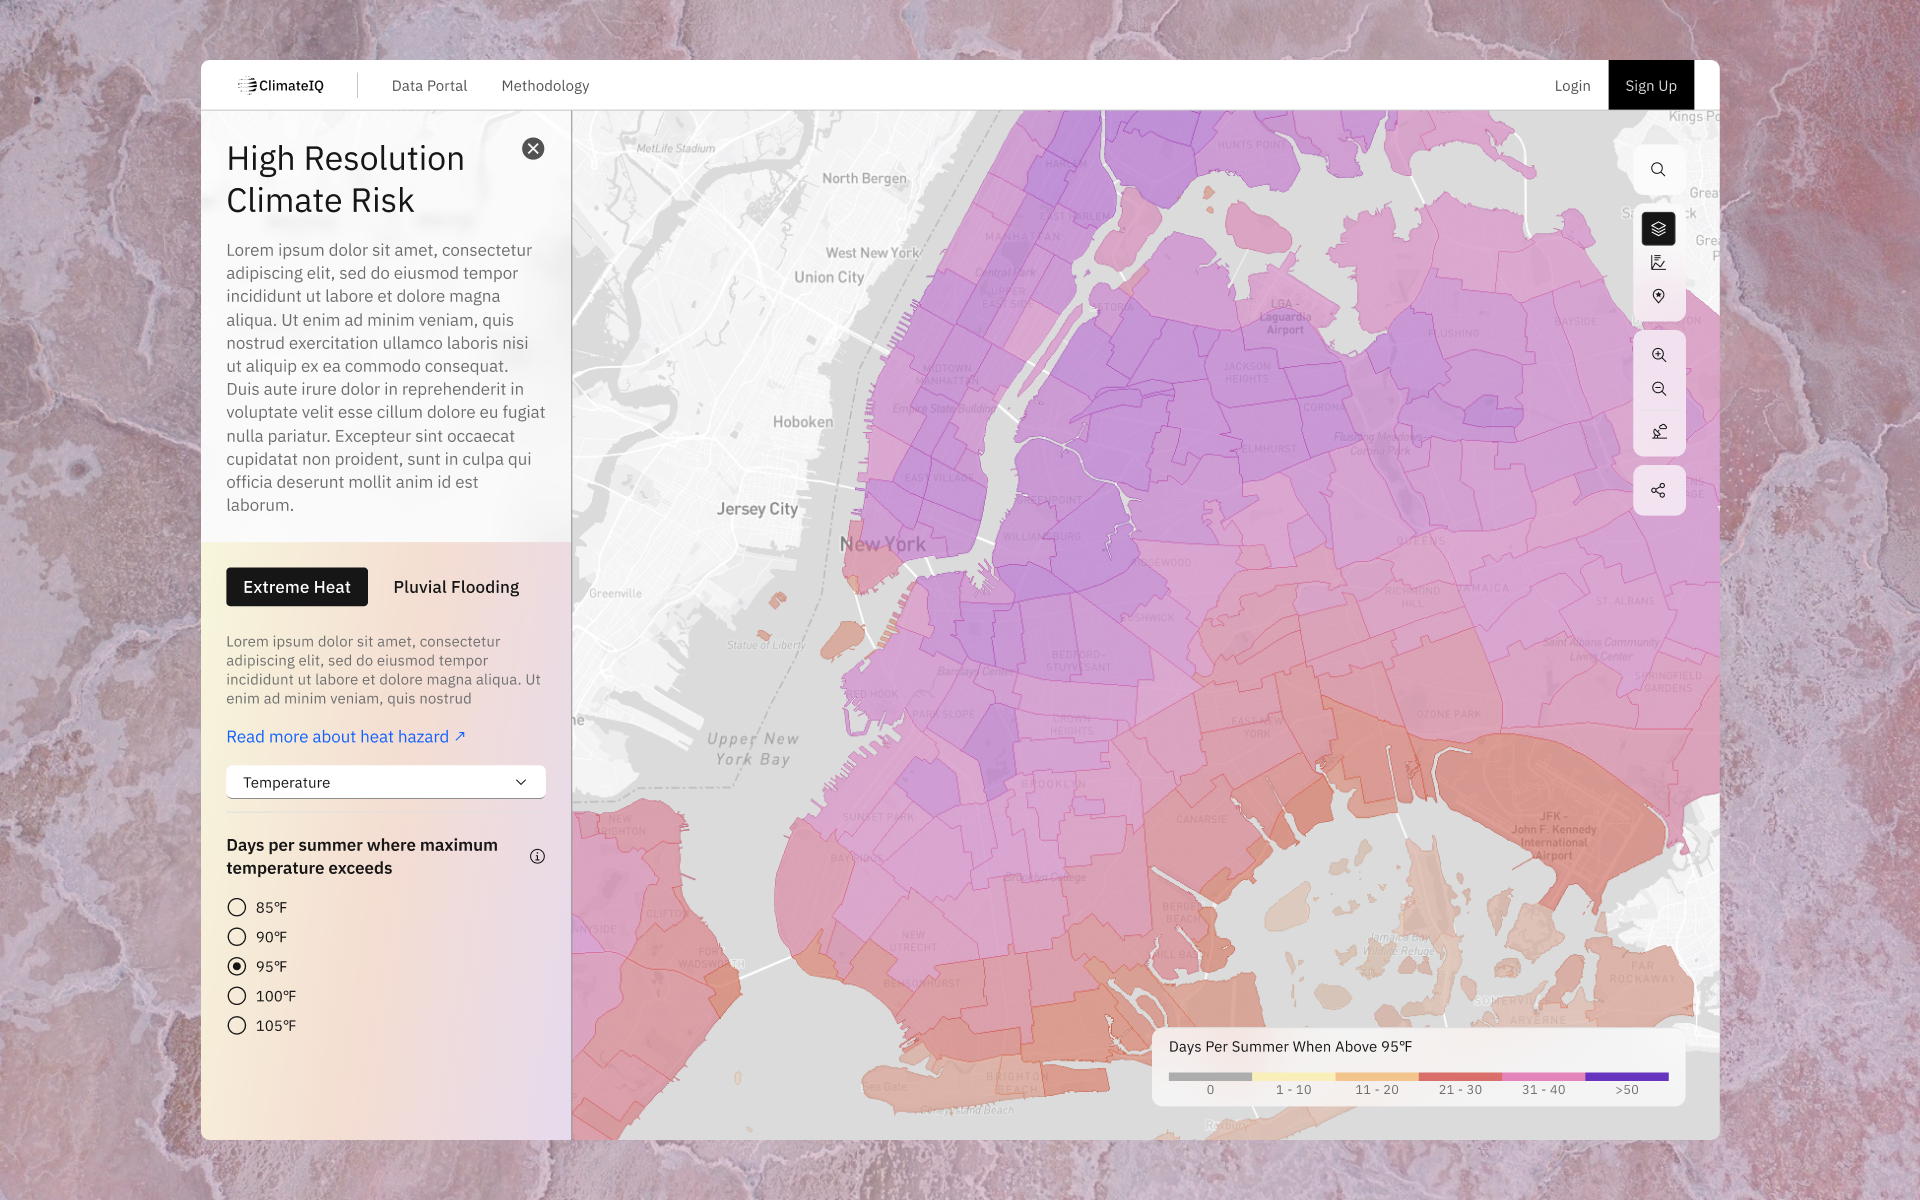
To deliver high-resolution, localised insights into rainfall-induced flooding and critical heat indices, I translated complex environmental data into an intuitive, agentic experience. The map is the starting point — but the experience layers in actions, briefings, and an at-a-glance summary designed for people who don’t have a GIS team behind them.
Every interaction was tested with the kind of users Google.org wants this in front of: local council staff, mutual-aid organisers, climate-resilience researchers, and front-line health workers. Their feedback drove the “less map, more answers” direction.

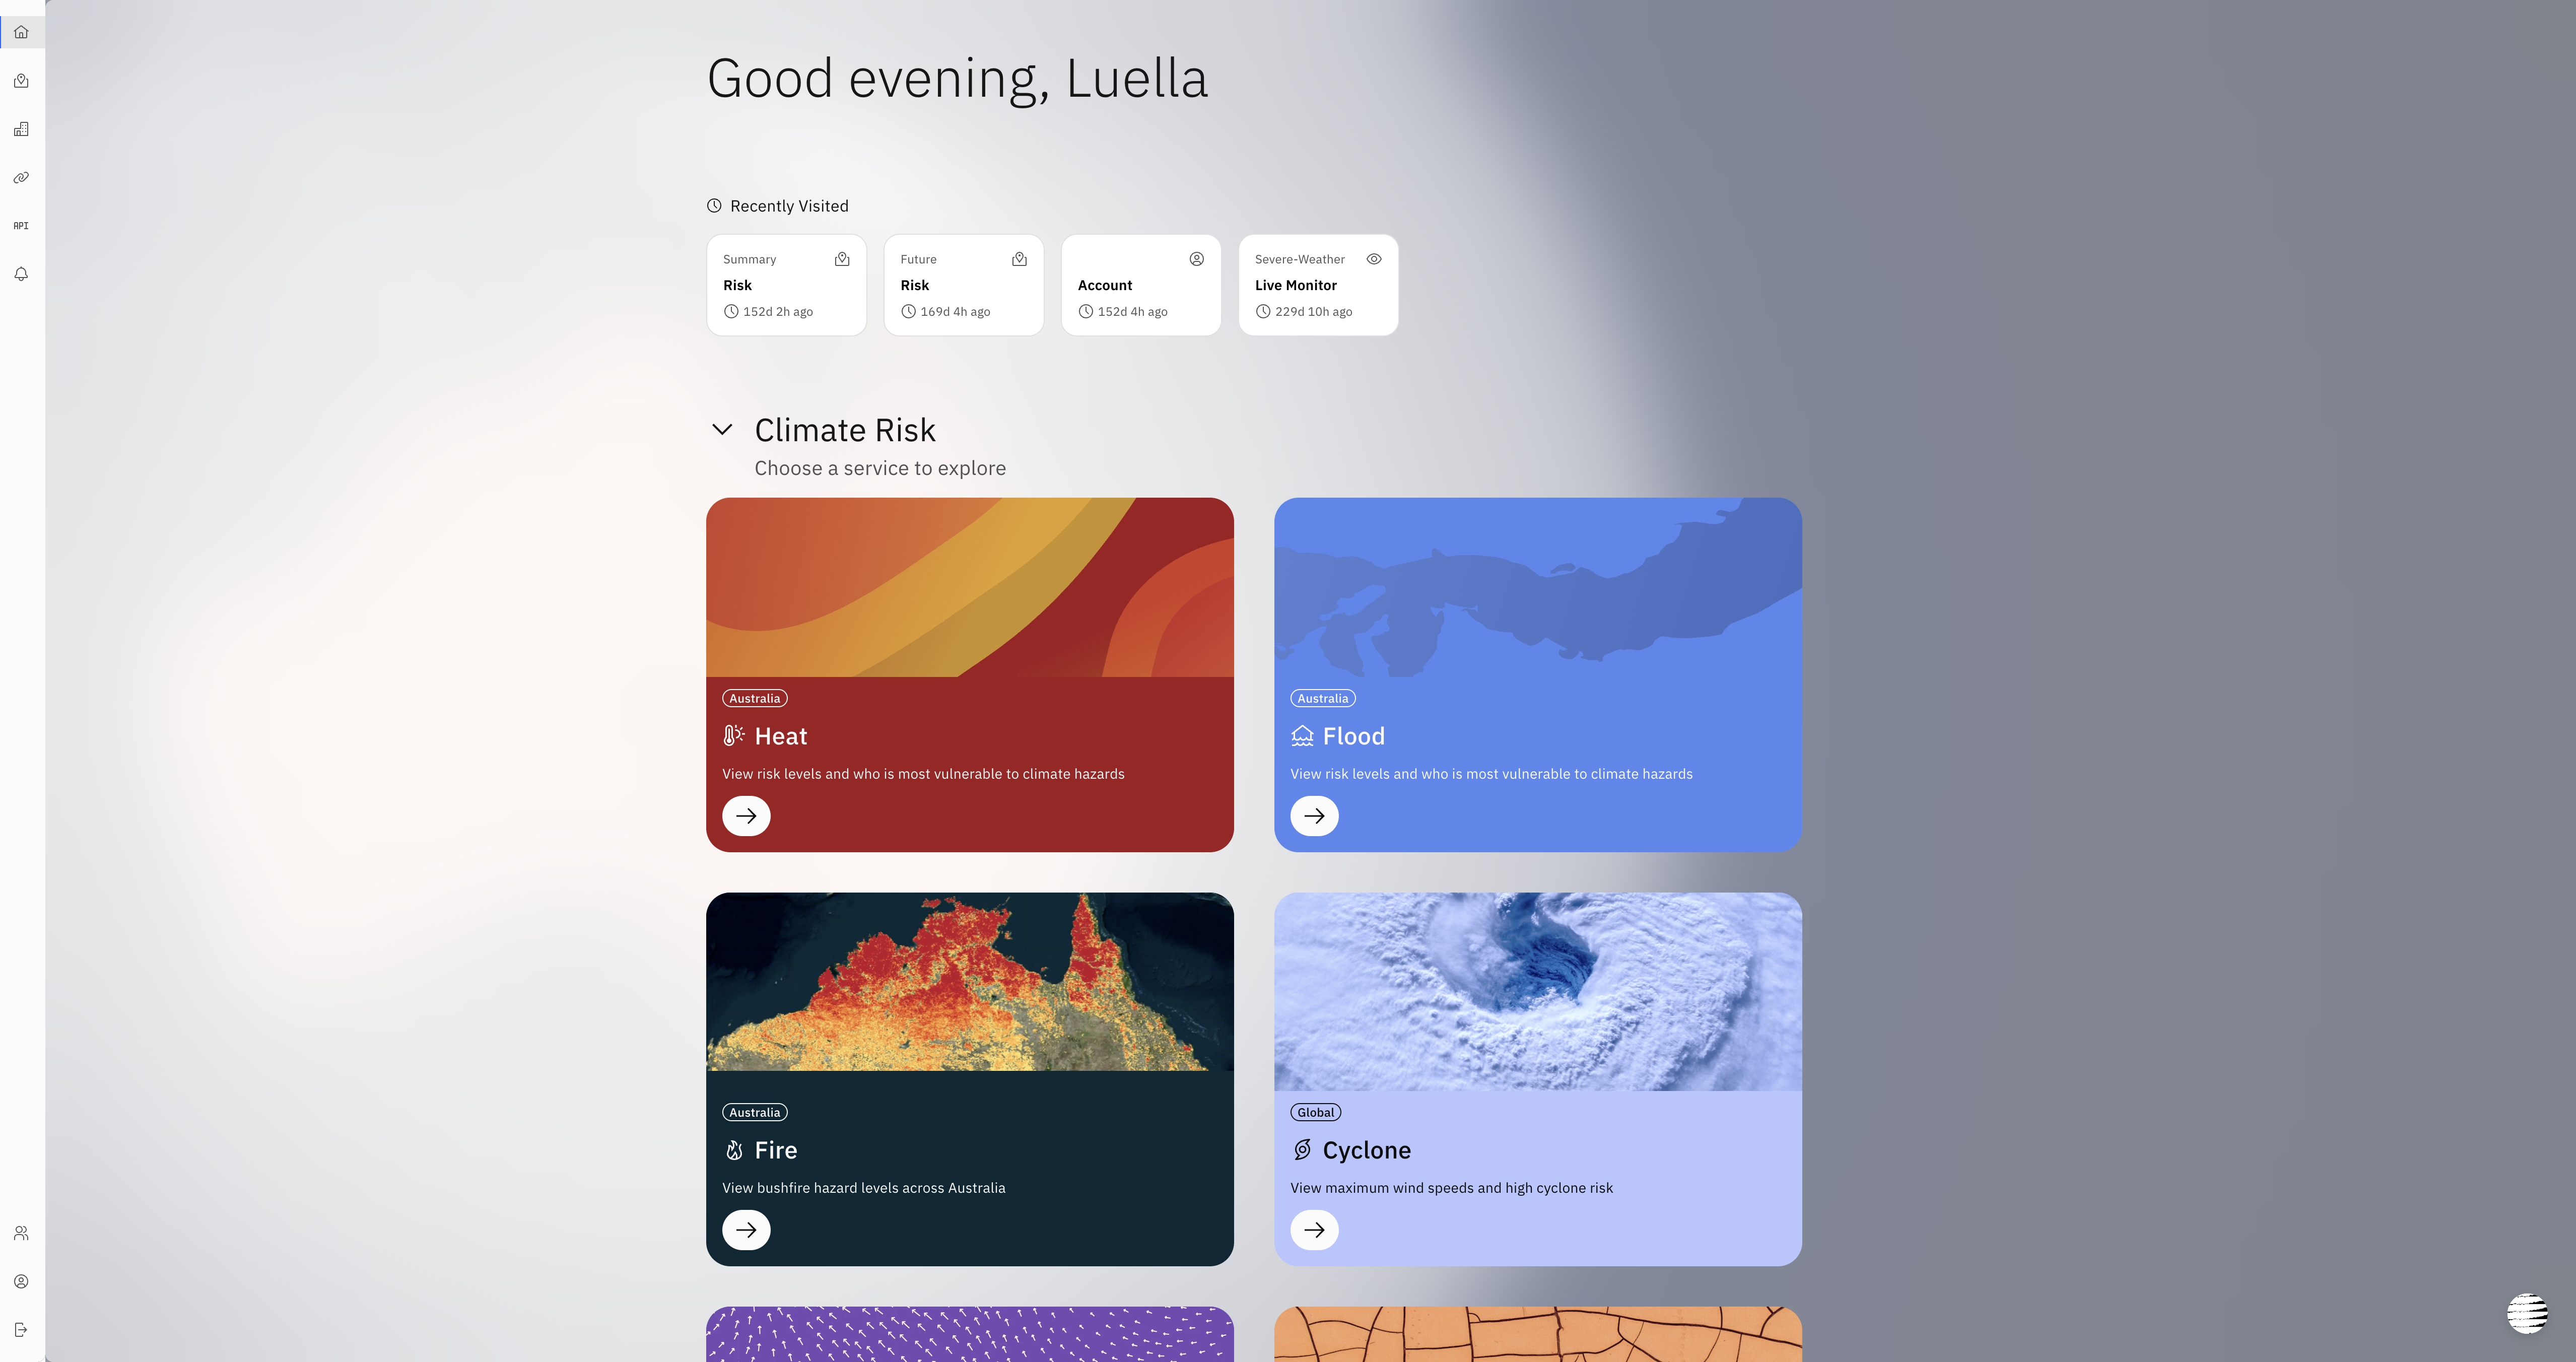
Scalable Designs for the Future
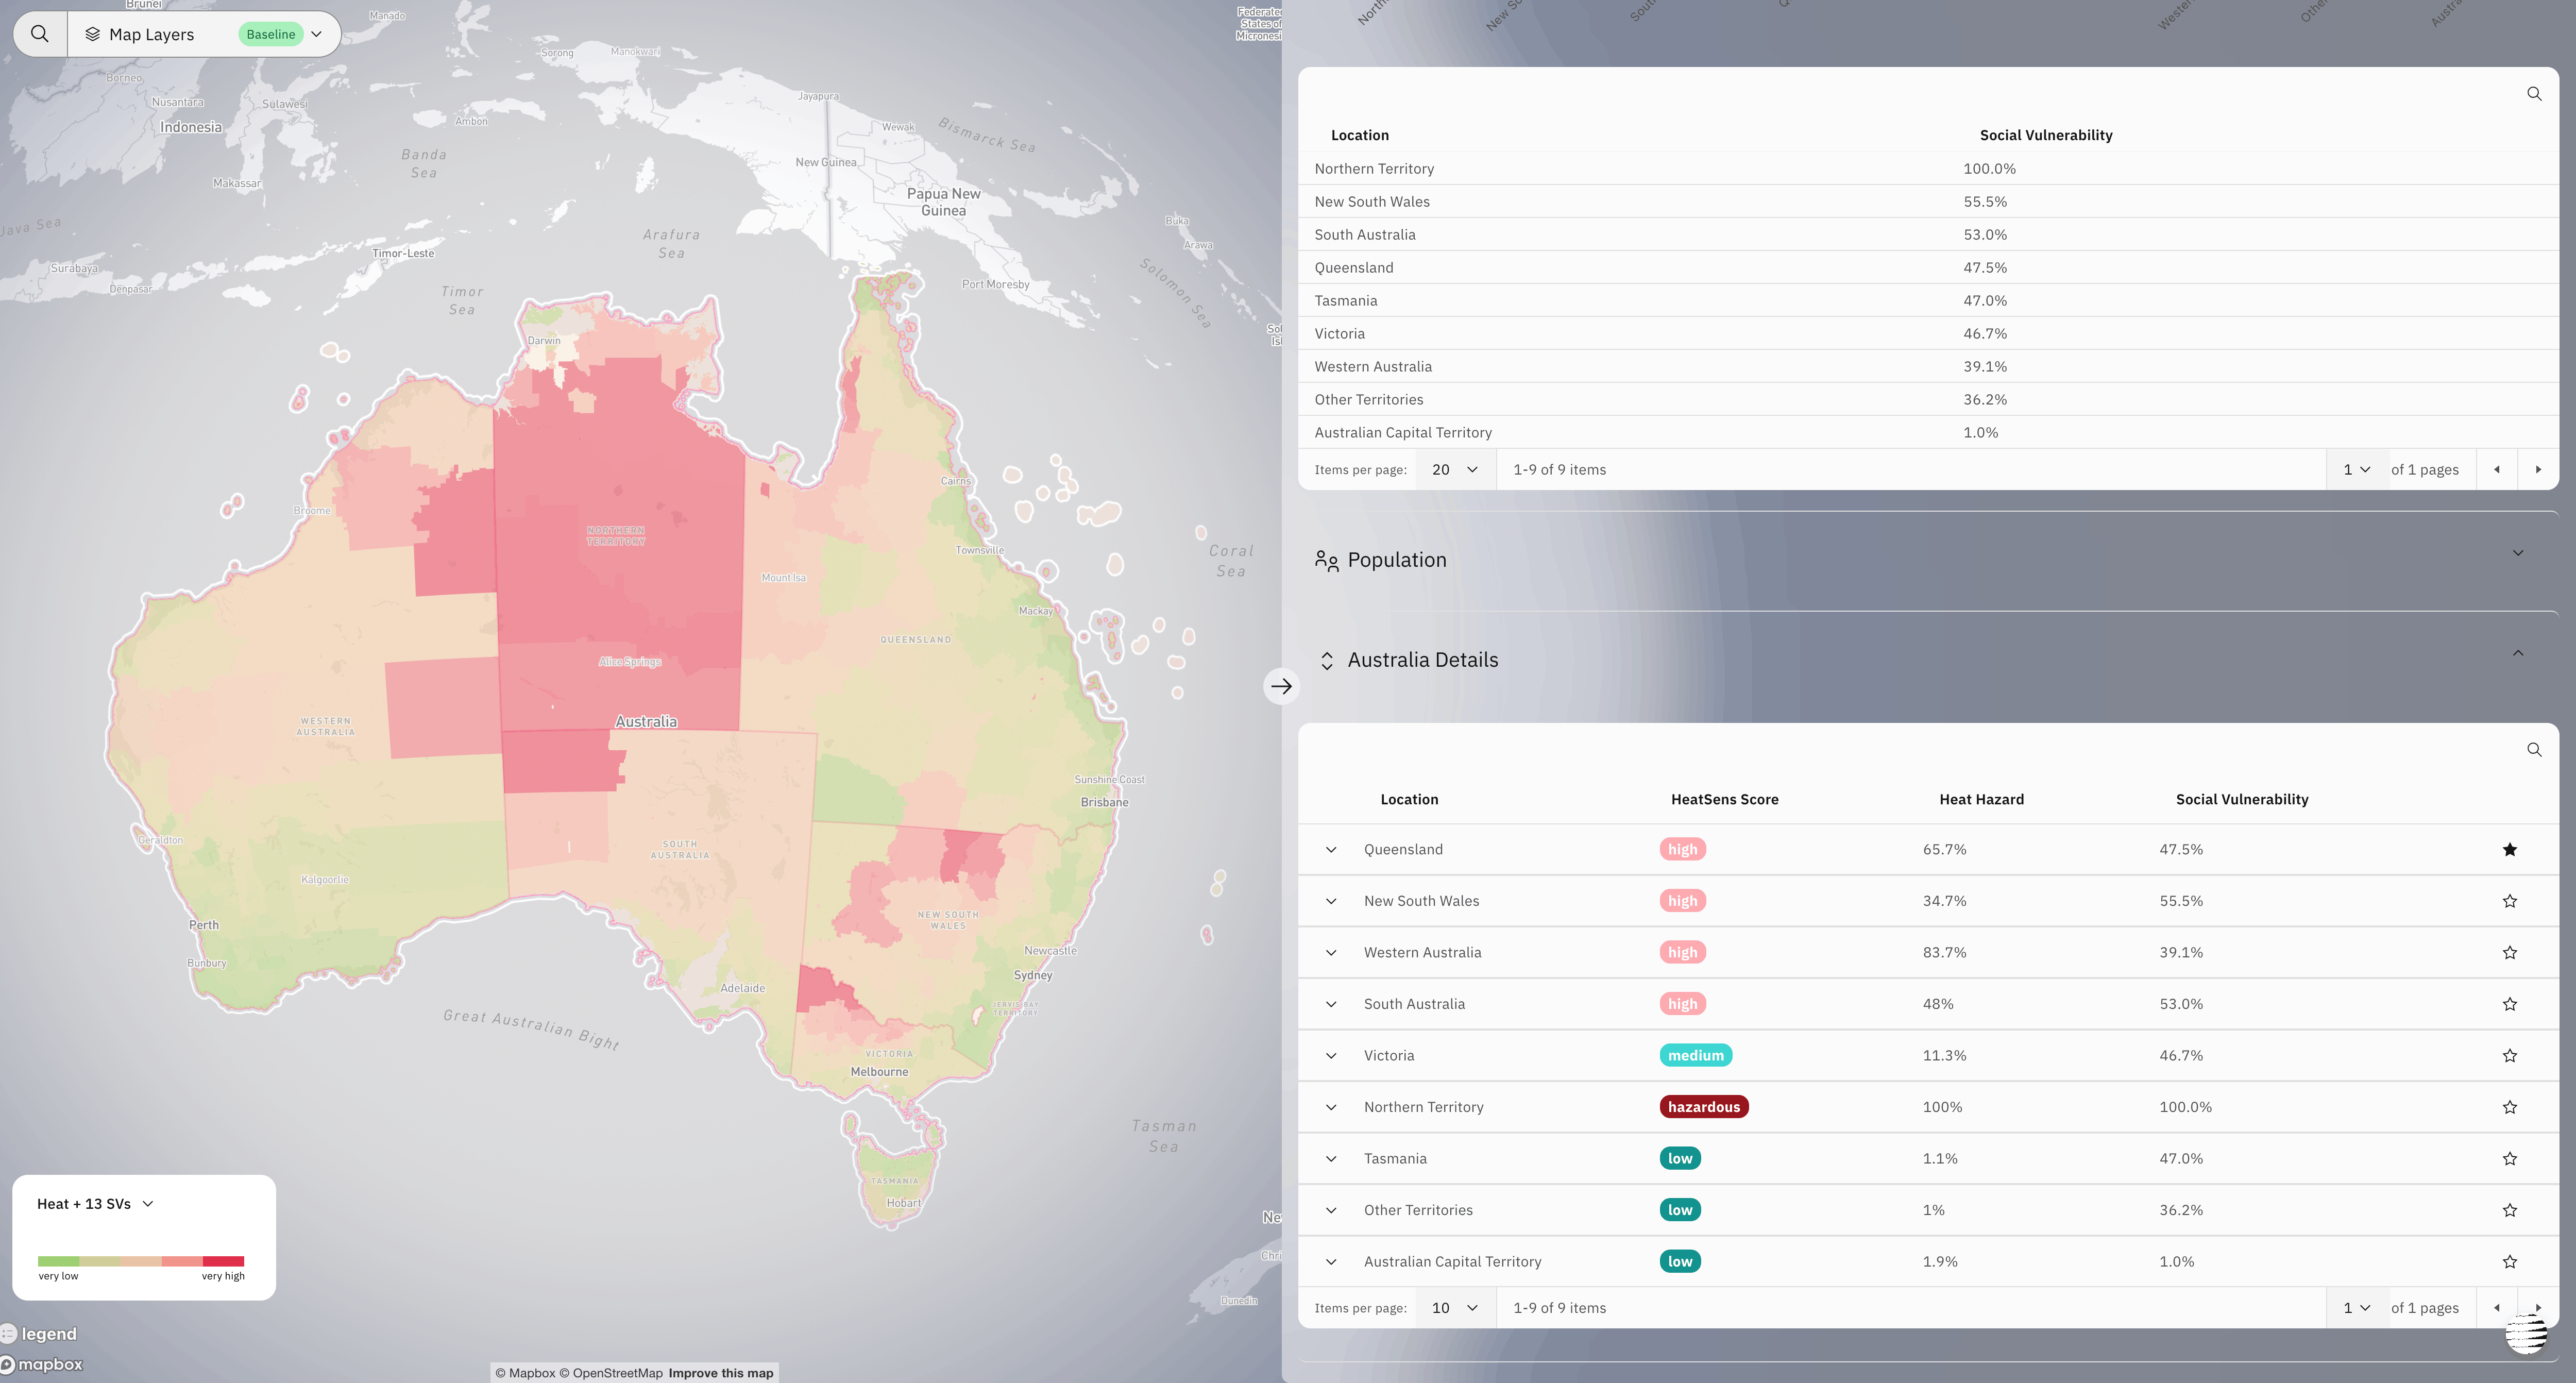
To drive the project’s strategic success, I developed a high-efficiency multi-hazard layout that simplified simultaneous risk visualisation, allowing our team to hit the aggressive 2024 Climate Week deadline.
I took a hands-on approach to the technical execution by using Storybook to streamline the design system for our engineers, guaranteeing a responsive and pixel-perfect build. This work, paired with a comprehensive redesign of the platform and landing page, was a key factor in attracting and onboarding the high-profile global partners now anchoring the platform.
Some progress is held back by NDA.
For the deeper walkthrough, contact me directly: qinglu.design@gmail.com
Or discover other inventive designs, creative solutions, and successful collaborations across AI, DataVis, and more.