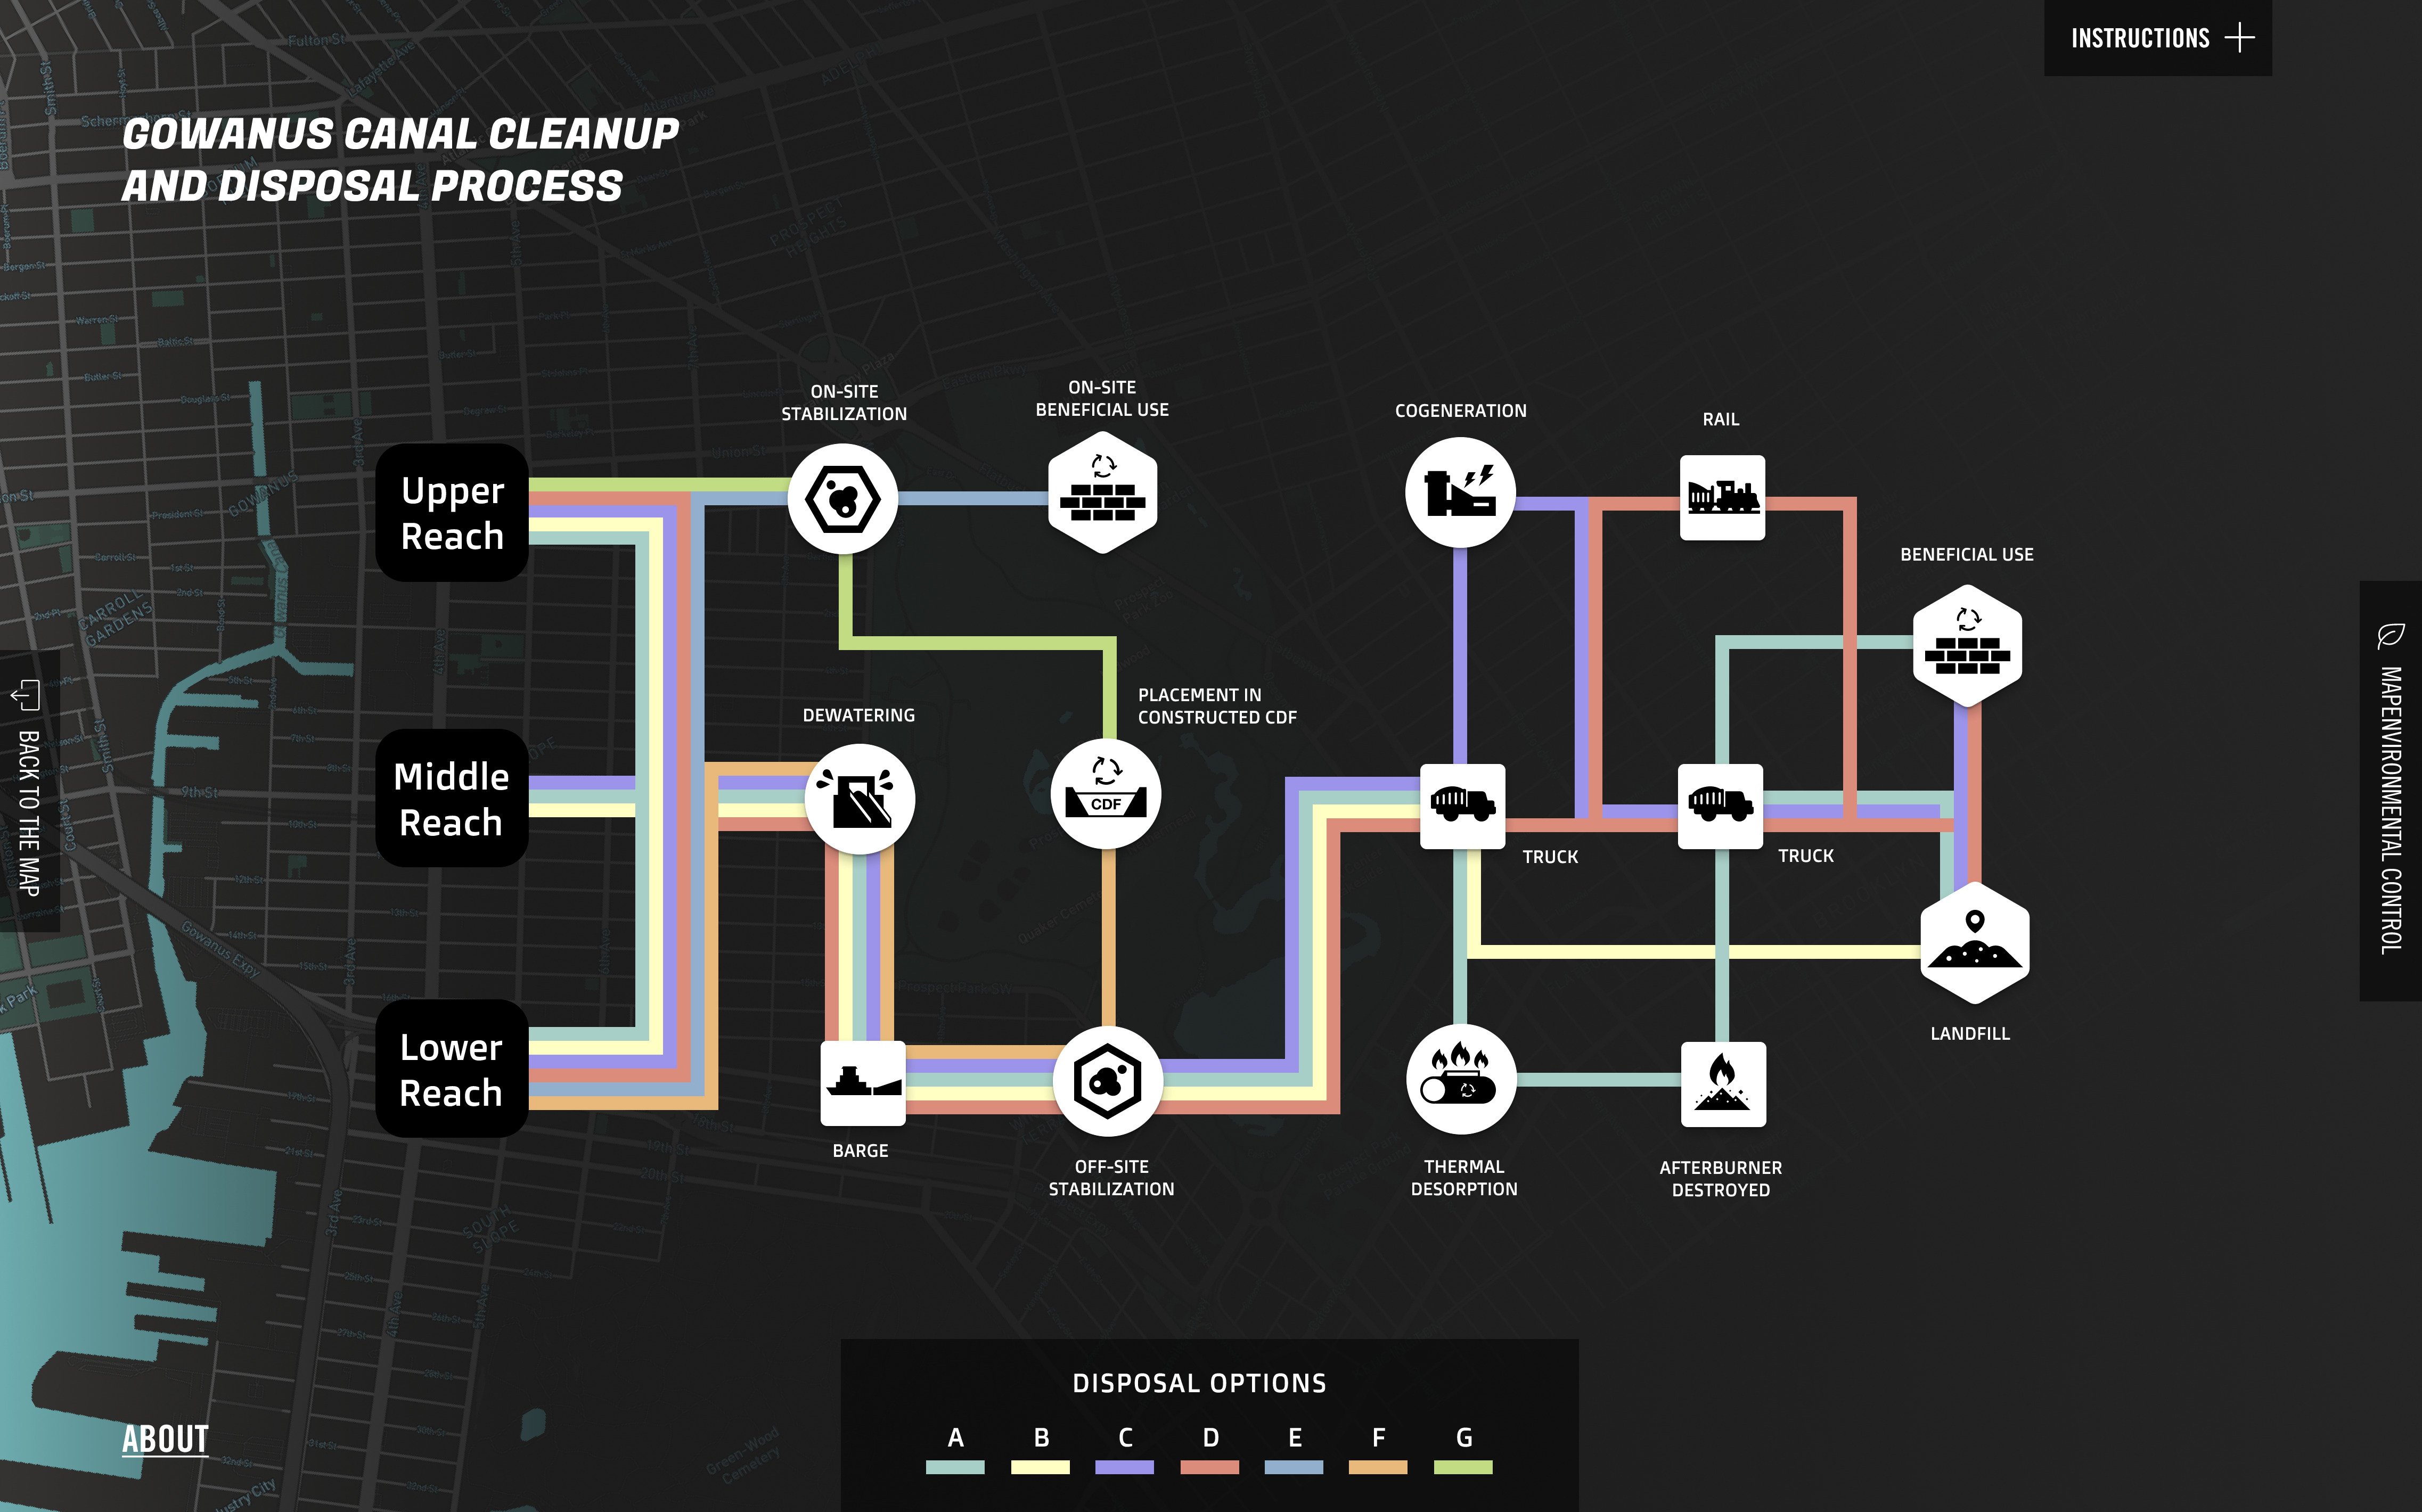
Gowanus Canal Cleanup and Disposal Process
Tools — Illustrator, Figma

— a partial record
Mainly interactive data-viz pieces, taken straight from design through to development.
Tools — Illustrator, Figma
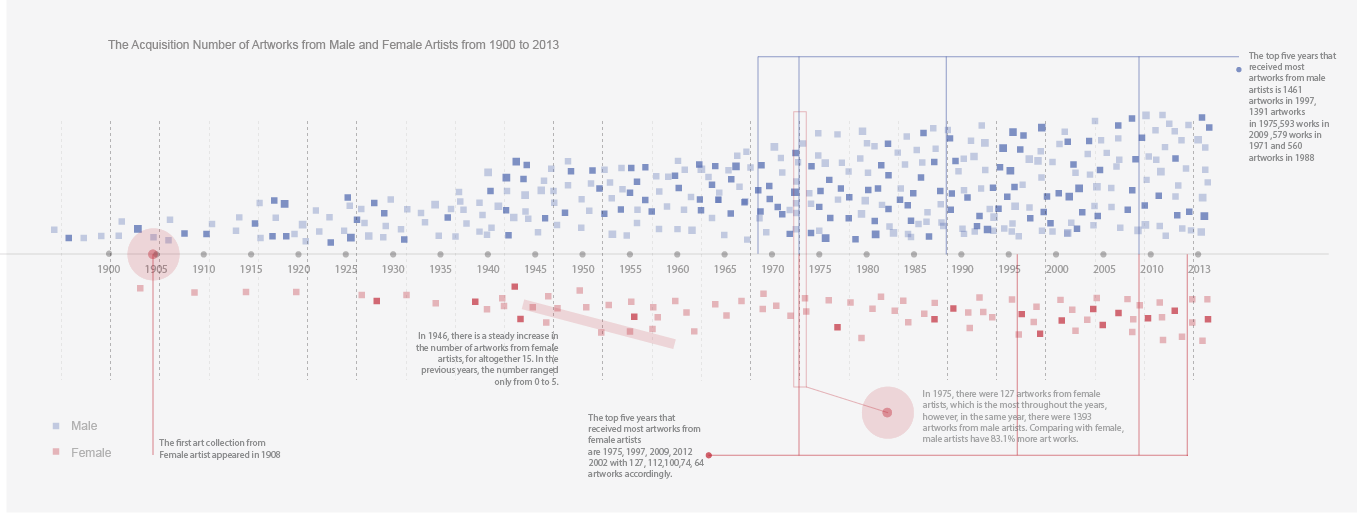
Tools — JavaScript, AMcharts, Figma
Tools — JavaScript, AMcharts, Figma
Tools — Illustrator
Tools — Mapbox, JavaScript
Tools — Figma, Mapbox, JavaScript
As a lover of contemporary art, I’ve also designed posters and social-media visuals for museum events.
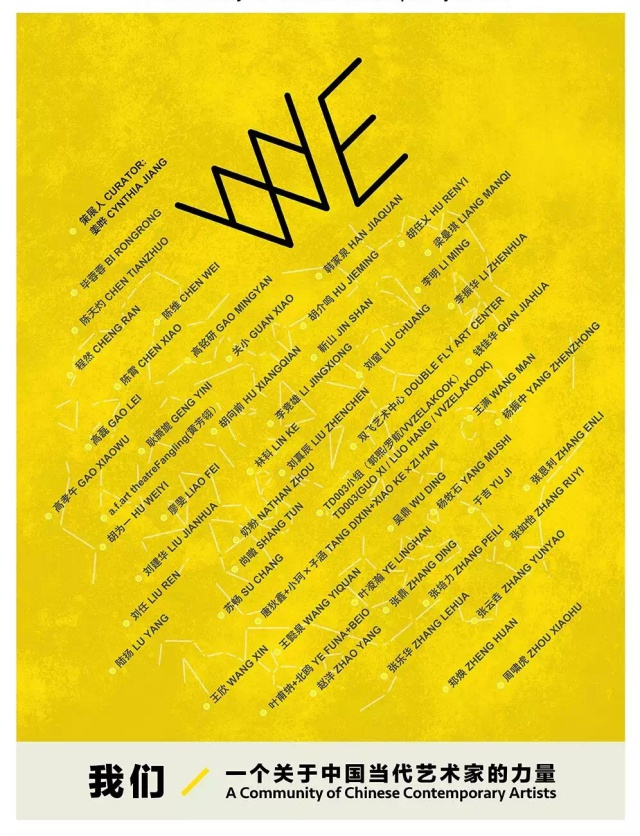

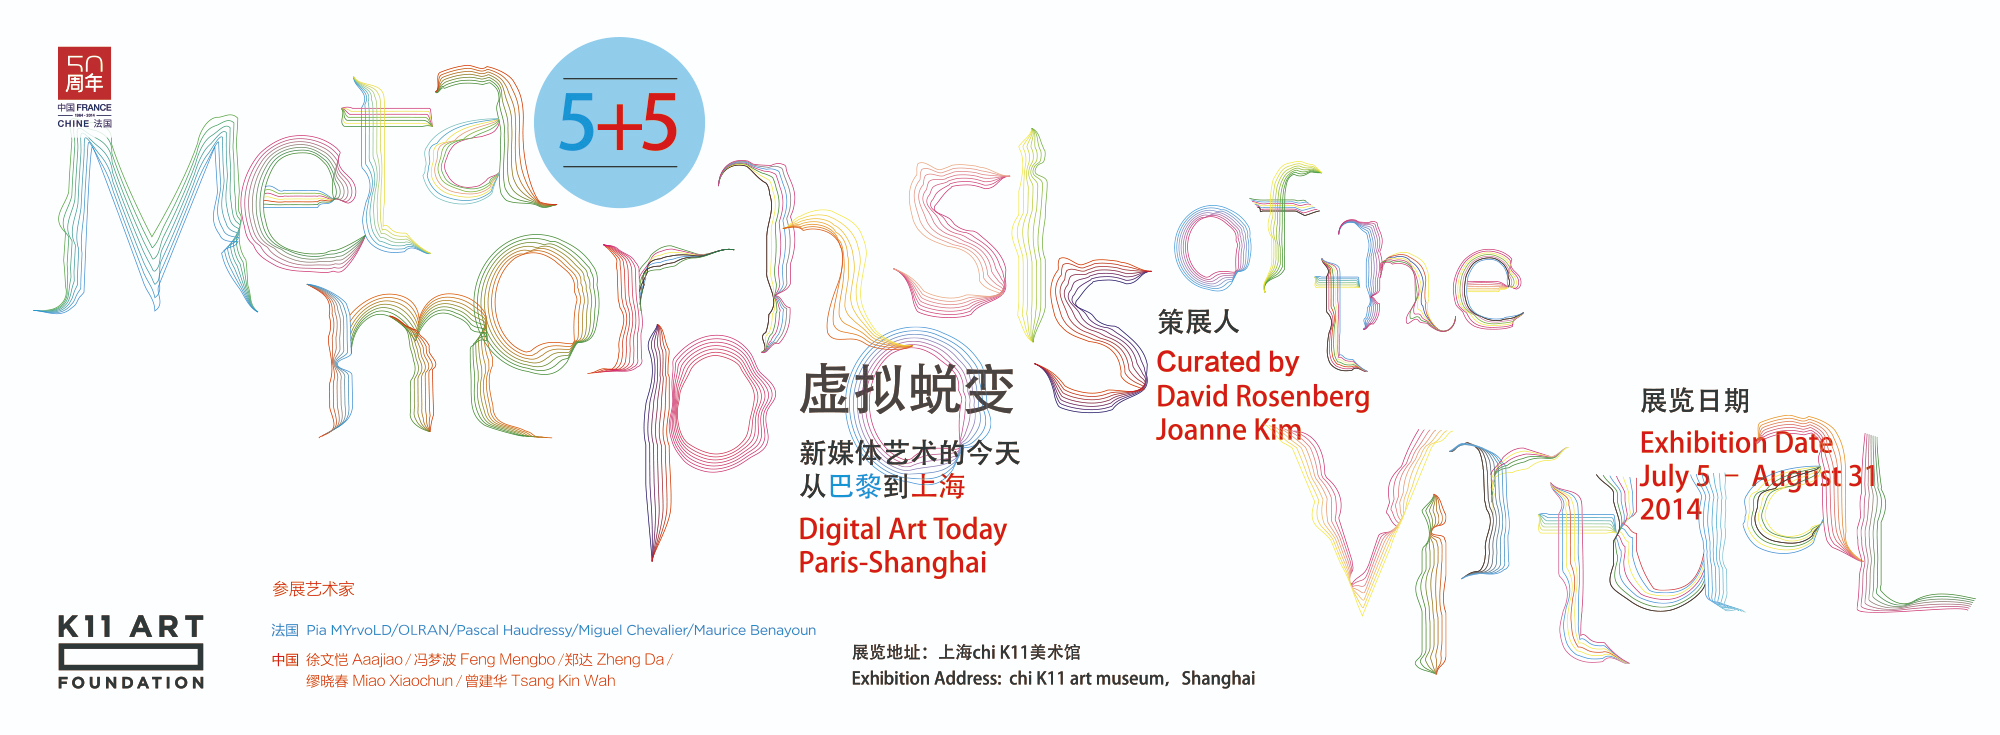


Mostly editorial pieces — printed posters, programme covers, and Instagram-first visuals. A working archive I add to whenever a museum sprint, gig poster or one-off graphic comes through.